Assessment tool assists communities in identifying climate critical areas and infrastructure that could be impacted by significant changes in temperature and precipitation.
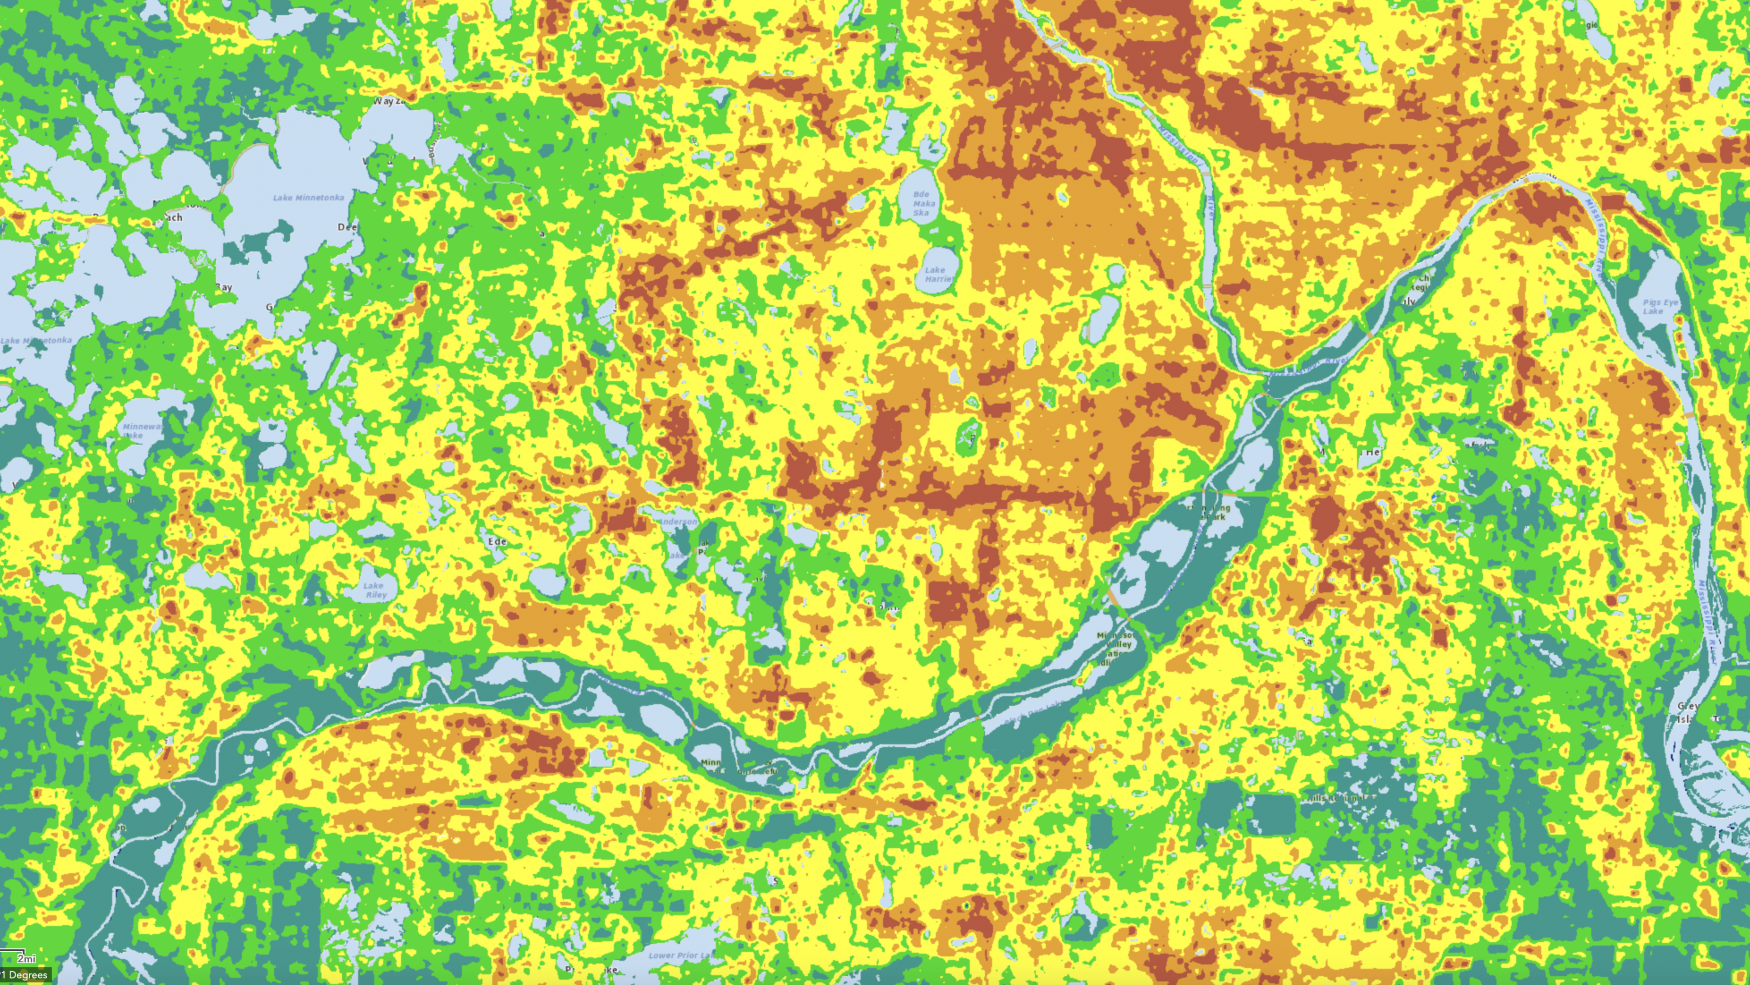
To help plan for impacts of a changing climate, the Metropolitan Council developed a Climate Vulnerability Assessment. These data and tools will help the Council and local communities maintain public infrastructure with climate change in mind. Tools include an Extreme Heat Map Tool, Localized Flood Map Screening Tool, Extreme Heat story map and a Localized Flooding story map. This combination of data tools can help us understand which neighborhoods and communities are more vulnerable to flooding and extreme heat.
Users can easily identify the location of urban heat islands in the Twin Cities. Urban heat islands occur in areas where solar energy gets trapped in paved surfaces (roads, parking lots, rooftops) and is not mitigated by a sufficient tree canopy or other vegetation. The urban heat island effect is further exacerbated by exhaust heat from idling automobiles and the operation of heating and cooling units.
In addition to data one might expect in such an analysis — land cover, heat data, air quality, and population density — the assessment also includes data to address equity issues related to income, poverty, home ownership, asthma hospitalization and more.
More information: Climate Vulnerability Assessment Tool (Met Council)